For this session, we will use gcc rather than the default compiler on Raijin (which is the Intel C compiler icc). You will need to replace the compiler module on Raijin as follows:
module unload intel-cc; module load gcc
The program heat.c sets up and solves a 2-D heat diffusion problem.
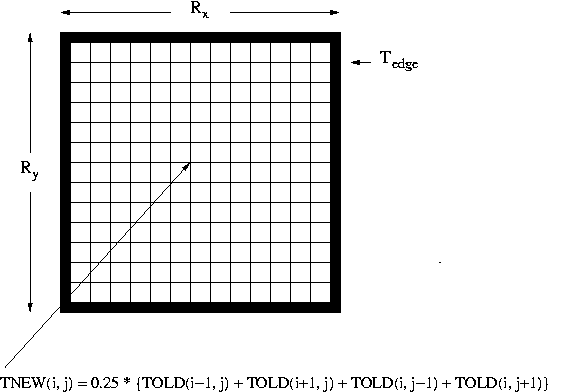
This models a metal plate of size by for which the temperature at the edge is held at some constant value . The aim is to determine the temperature in the middle of the plate. This is done iteratively by dividing the domain of the metal plate into a grid of points. The new temperature at each grid point is calculated as the average of the current temperatures at the four adjacent grid points. Iteration continues until the maximum change in temperature for any grid point is less than some threshold. A diagrammatic illustration of the problem is shown below:

The code requests as input:
Except at the edges, each grid point is initially set to zero. For problem sizes with Nx and Ny less than 20 the resulting temperatures are printed. This is really just for interest.
The code has been parallelized using MPI.
Run the code mpirun -np 1 ./heat with input:
10 10

100.0

100

0.1
just to make sure it works.
To analyze the computational breakdown, we can use either hardware or software measurements.
Hardware performance counters
Cray started this with something called the hardware performance monitor. This was an easy means by which users could get MFLOP rates at the end of their calculations. The downside to this was the fact that it lead to users quoting “machoflops” - meaning that in some cases it is possible to have very good MFLOP ratings, but the time to solution is actually longer than that for an alternative algorithm that does less flops.
Hardware performance counters in general have very low runtime overhead, but require chip real estate that used to be expensive. However, with ever smaller feature sizes, chip space is no longer a major issue and we are now seeing hardware performance counters on virtually all processors, e.g. see: PAPI.
Software instrumentation of the program
Add timing points around basic blocks, and statistically sample the program counter to build a profile.
Low HW cost, higher runtime overhead.
Unix (and Linux) prof and gprof are well-known examples, other vendors may offer their own tools, such as VTune from Intel.
We can obtain a rough estimate of time spent at the basic block level using a coverage tool like gcov. To do this, recompile the code with additional compiler options, running it and post-processing the output files as follows:
$ make heat_cov
$ mpirun -np 1 ./heat_cov < heat.input
$ gcov heat.c
This will give you a file heat.c.gcov. If you look in here you will see output of the form:
       -:   93:        // update local values
       10:   94:        jst = rank*chk+1;
       10:   95:        jfin = jst+chk > Ny-1 ? Ny-1 : jst+chk;
    49990:   96:        for (j = jst; j < jfin; j++) {
249850020:   97:            for (i = 1; i < Nx-1; i++) {
249800040:   98:                tnew[j*Nx+i]=0.25*(told[j*Nx+i+1]+told[j*Nx+i-1]+told[(j+1)*Nx+i]+told[(j-1)*Nx+i]);
        -:   99:            }
        -:  100:        }
where the large numbers on the left indicate the number of times that each line of code has been executed (a # indicates the line was not executed).
There are a variety of tools available for analyzing MPI programs (go to the NCI software developer guide and look under Debuggers and Profilers. Also see the NCI MPI Performance Analysis Tools wiki page).
mpirun -np 8 ./heat < heat.input and
inspect both the text and graphical output (you need to load the ipm
module, run the code, and then use the ipm_view ipmfile
, where ipmfile is the name of the IPM generated file
(a long name ending in .ipm).
You also will
need to have logged on to Raijin with X forwarding, i.e. ssh
-X MyID@raijin, so that a new window can be displayed).
make clean,
then module unload ipm, then module load
mpiP. Now type make and run the program. It
should produce a file called something
like heat.XXX....mpiP, where XXX indicates
the number of MPI processes used. Inspect this file. What
information is provided? How does this profiler compare with ipm?
The iterative part of heat.c is given below:
do {
    iter++;
    // update local values
    jst = rank*chk+1;
    jfin = jst+chk > Ny-1 ? Ny-1 : jst+chk;
    for (j = jst; j < jfin; j++) {
        for (i = 1; i < Nx-1; i++) {
            tnew[j*Nx+i] = 0.25*(told[j*Nx+i+1]+told[j*Nx+i-1]+told[(j+1)*Nx+i]+told[(j-1)*Nx+i]);
        }
    }
    // Send to rank+1
    if (rank+1 < size) {
        jst = rank*chk+chk;
        MPI_Send(&tnew[jst*Nx],Nx, MPI_DOUBLE, rank+1,
                            2, MPI_COMM_WORLD);
    }
    if (rank-1 >= 0) {
        jst = (rank-1)*chk+chk;
        MPI_Recv(&tnew[jst*Nx],Nx, MPI_DOUBLE,rank-1,
                            2, MPI_COMM_WORLD, &status);
    }
    // Send to rank-1
    if (rank-1 >= 0) {
        jst = rank*chk+1;
        MPI_Send(&tnew[jst*Nx],Nx, MPI_DOUBLE, rank-1,
                            1, MPI_COMM_WORLD);
    }
    if (rank+1 < size) {
        jst = (rank+1)*chk+1;
        MPI_Recv(&tnew[jst*Nx],Nx, MPI_DOUBLE, rank+1,
                            1, MPI_COMM_WORLD, &status);
    }
    // fix boundaries in tnew
    j=0;    for (i = 0; i < Nx; i++) tnew[j*Nx+i] = Tedge;
    j=Ny-1; for (i = 0; i < Nx; i++) tnew[j*Nx+i] = Tedge;
    i=0;    for (j = 0; j < Ny; j++) tnew[j*Nx+i] = Tedge;
    i=Nx-1; for (j = 0; j < Ny; j++) tnew[j*Nx+i] = Tedge;

    jst = rank*chk+1;
    lmxdiff = fabs((double) (told[jst*Nx+1] - tnew[jst*Nx+1]));
    jfin = jst+chk > Ny-1? Ny-1: jst+chk;
    for (j = jst; j < jfin; j++) {
        for (i = 1; i < Nx-1; i++) {
            tdiff = fabs( (double) (told[j*Nx+i] - tnew[j*Nx+i]));
            lmxdiff = (lmxdiff < tdiff) ? tdiff : lmxdiff;
        }
    }
    for (i = 0; i < Nx*Ny; i++) told[i] = tnew[i];

    //find global maximum, all processes holding the result
    if (rank == 0) {
      ...
    } else {
      ...
    }
    if (!rank) printf(" iteration %d convergence %lf\n",iter,mxdiff);
} while (mxdiff > converge && iter < Max_iter);
Any parallel program can be divided into the following categories:
Parallel work: this is work that is efficiently divided between all participating processes. The sum of the parallel work across all processes is roughly constant regardless of the number of processes used.
Overhead: this is extra work that is only present because of the parallelisation. For example communication to send data from one process to another.
Replicated/sequential work: this is work that is either replicated on all processes or is done by one process while the other processes wait. The sum of the replicated work across all processes increases with the number of parallel processes.
Use coverage analysis (gcov)with 1, 2 and 4 processes
to verify your conclusions from above. Try both of:
When running coverage analysis for multiple MPI processes, you will obtain counts summed over all processes. You should be looking to see what happens to the count values as you increase the process count. Specifically you might expect to see the count value for the parallel work stay (roughly) constant, but the count value associated with replicated work double as you double the number of processes. As a corollary to this the % of the total time spent executing the replicated lines will increase.
HPCToolkit is another more elaborate profiler that is available at NCI. If you have time, you can try profiling the heat program running on 8 cores for the large problem size.