In the labs, there are often little tips and tricks put in that you could benefit from. This page collects those, and more, into one place so you can benefit. Some of the tips here may not be helpful yet because you haven’t reached the point where they can be used in the labs, so be sure to check this page again before beginning your assignments. We will also keep adding tricks as we find them; feel free to post on the forum and let us know about any you find too!
Digital#
Keyboard shortcuts#
Shortcuts for while you’re editing/viewing the circuit:
-
R: rotate objects - Scroll to zoom in/out
-
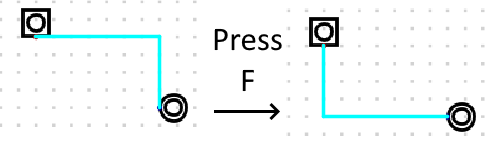
F: while drawing a wire, change its orientation (if it is currently horizontal then vertical, makes it vertical then horizontal) -
F1: fit screen to circuit size -
F5: opens the component tree view. This is discussed later, but essentially it is a window on the left of your screen with all the available components in a tree structure, which is very convenient and allows you to avoid having to open the Components menu from the top bar every time. -
L: insert another of the last element inserted -
T: insert a new tunnel -
Q: (As of Digital v0.30) copy the component the mouse is hovering over and allow placing more -
Ctrl+Click: (As of Digital v0.30) while holding Ctrl, clicking will place a component while allowing you to place more
Shortcuts for when you’re running/simulating the circuit (for manual testing):
-
Space: start/stop simulating the circuit -
F6: open measurement table, which shows every value in the circuit currently. -
C: alternates the current signal of the clock/does a clock step. Make sure to make your CLK aClock Inputfor this to work.
Many of the shortcuts you’re used to (e.g. Ctrl+Z to undo, Ctrl+Y to redo, Ctrl+C to copy, Ctrl+N for new circuit) will also work.
Chapter 9 of the Digital documentation (accessed by Help > Documentation) gives a list of all the keyboard shortcuts
for your perusal.
(Note: if some of these shortcuts are different in Mac, please let us know; we’ll update the guide)
Change how components look#
Press R to rotate objects.
You can make gates slightly thinner:
- Right click on the gate after placing and in the Advanced tab, deselect “wide shape”
You can mirror wire splitters, as well as making their inputs and outputs more spread out, e.g. to put space to put labels on each wire splitter output:
- Right click on the splitter and go to the Advanced tab, where you will see these options.
Usually when you make a custom circuit and import it, it will be too thin and all the input/output labels will overlap
into a huge mess. To fix this problem, open the custom circuit (right click and press “Open Circuit”), navigate Edit > Circuit Specific Settings and adjust the Width as appropriate (somewhere around 5-8 is probably ideal).
You can actually modify the shape of custom circuits further because their shape is just stored in an SVG file. Go under
Edit > Circuit Specific Settings > Advanced and export the template for the circuit as SVG, which you can edit in Inkscape or any other suitable tool.
Get more out of your components#
You can right click on some in-built components to adjust the bit count of their inputs and outputs, including logic gates. This will become pretty much necessary as you build more complex circuits.
You can have OR and AND gates with more than 2 inputs (e.g. 4 input OR, which will output 1 if at least one of its inputs is 1):
- Right click on the gate after placing and change the number of inputs
- Useful if you want to check more than 2 conditions are true at once, e.g. for a number, testing if bit 0 is 0 AND bit 1 is 0 AND bit 2 is 0 AND … so on can be done with one large AND gate combining the tests on each bit.
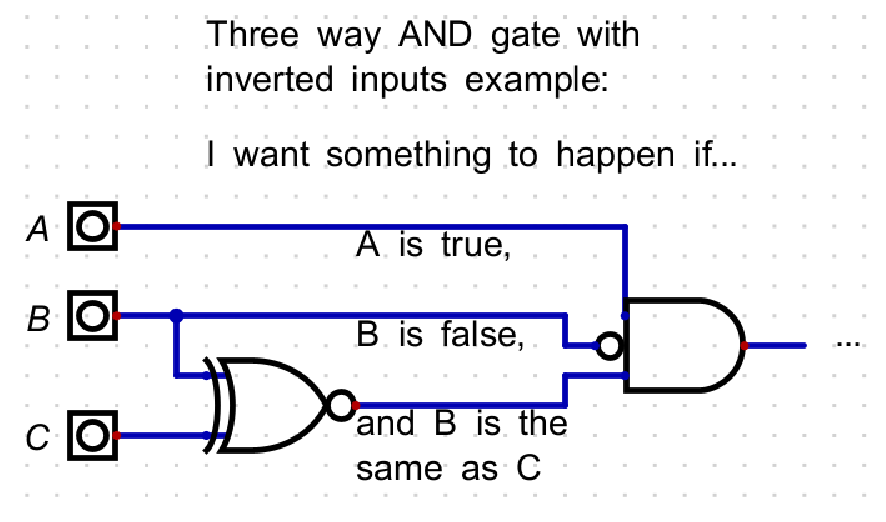
You can negate specific inputs for OR and AND gates:
- Right click on the gate after placing and edit “Inverted inputs”
- Useful if you’re checking conditions, and for some of them you want to check the inverse condition.
There are several tricks you can do with wire splitters:
- You can use ranges of bits, e.g. 0, 1-3, 4, 5-8 indicates to have 4 wires, where the first has 1 bit (bit 0), the second has 3 bits (bits 1, 2 and 3) and so on.
- You can use * to indicate repetition, e.g. 1 * 8 gives 8 wires with 1 bit each. This is easier compared to 1,1,1,1,1,1,1,1
- Read the wire splitter documentation (right click on wire splitter -> Help) for more.
To use registers in tests and see what values are in them in the measurement table (press F6), right click on the register, go to the advanced tab and tick “use as measurement value”.
Useful components#
-
IO > Probe: Tells you the value in the middle of a wire during runtime. Useful especially for wires carrying multiple bits, and getting visual feedback on what’s going on. -
Wires > Tunnel: Allows wires to skip between tunnels of the same label/name. -
Misc. > Decoration > Text: Basically allows putting comments on your hardware. The component “rectangle” is similar. -
Plexers > Decoder: You likely remember the multiplexer that is in this section, but don’t forget the decoder! You may remember from lectures that it outputs 1 on exactly one of its outputs depending on the input. Useful for breaking down control signals such as the ALUOP. -
Misc > Break: This allows you to use the button in the top bar next to play that looks like>>|, or pressF7, to Run to Break. The circuit will run until the value inputted to Break goes from 0 to 1. Useful for debugging (though the tutor writing this has actually never used it before, but it seems useful!).
Testing your circuits manually#
You have definitely run tests on your circuits, but you may not know that you can run the circuit in an “interactive mode” where you can change the inputs manually and see what happens to the outputs. In Digital’s official terminology, this is called running a simulation. This can be done with the “play” button in the top bar, or pressing Space.
When simulating, you can hover on different wires to check the value going through them, right click on inputs to change their value, and more.
Gate stepping#
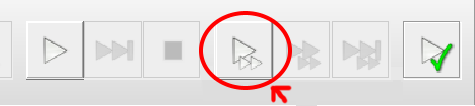
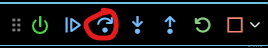
For finer debugging when running your circuit, you can use something called single gate step mode. Press the play button with two smaller play symbols in it in the top bar, which is circled in red below. Then, when you change an input, it steps through the changes in each gate in the circuit. You can press V to advance by gate steps.
Testing sequential circuits#
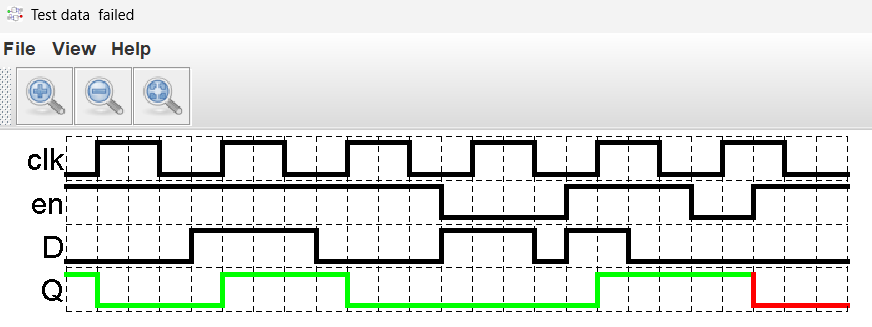
In sequential circuits, values may depend on what inputs and state values were before, not just now. Hence, it is useful to view tests not in the table format, where you only see what the values are at particular snapshots, but in a data graph. When viewing test results, press the button shown below, and it will show you a graph with how the inputs and values have evolved over time. This should be more helpful in interpreting the results and figuring out what went wrong.
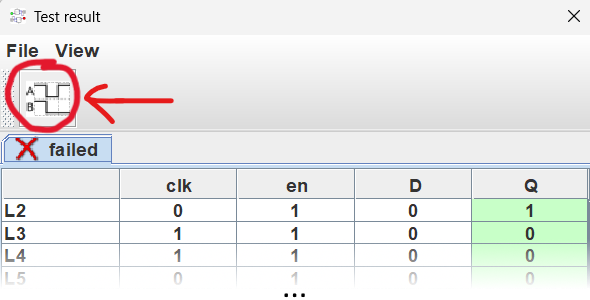
This is what the data graph looks like (for reference, this is from an incorrect implementation of the D-flip-flop with enable from lab 3):
You can also place a Data Graph directly on your circuit from IO > Data Graph and see the graph update in real time when
you simulate the circuit and play around with it, which can help debug things.
CPU testing#
Once you have added your instruction memory in lab 5, you will be ready to test your CPU on actual programs. You can put in a program into memory by right clicking the memory component while simulating the circuit and manually typing in the machine code of your program, which is what the labs instruct you to do. However, this is very tedious, and when you run your circuit again your program will be gone.
A better method is to write your program on a file and have Digital load it in. If you right click on your instruction memory, you can find a tickbox in the advanced tab labeled “program memory”, which you should tick. Then, in Edit > Circuit specific settings, in the Advanced tab, you can find an option to “preload program memory at startup” and specify a file. Digital will then load in the contents of the file into your memory each time you start the circuit, so you have your program already there! The issue here is that it will literally copy the raw binary data from the file, so if you try typing in something in human-readable text (which will be ascii characters), it won’t make sense to Digital. Instead, you will need to write the file in a hex editor to be able to put raw binary in. The author’s weapon of choice is Hex Editor Neo; there is also a Hex Editor extension for VSCodium and you can likely find hex editors of your own.
The problem with this method is that you still need to manually convert the program from assembly language to machine code. In that area, the COMP2300 team has your back; we have made a VSCode extension that includes an assembler and a debugger for QuAC, instructions for which you can find here. This extension can turn your assembly (written in human-readable assembly instructions) to machine code, which is outputted in a file that you can tell Digital to pre-load into memory as described earlier. You can even step through the program on your circuit directly through VSCode, since the extension can link into Digital!
This is all well and good if you want to test your CPU by stepping through your program manually when simulating the circuit, but what if you want to write automatic tests? You can indeed write test cases and specify programs to run on your CPU, as well as expected outputs, using the powerful program function. This specifies a program that is loaded into the program memory at the beginning of the test case. Then, since your CPU executes an instruction each CLK cycle, using C you can write a test indicating the expected register values after each instruction. An example of this is shown below.
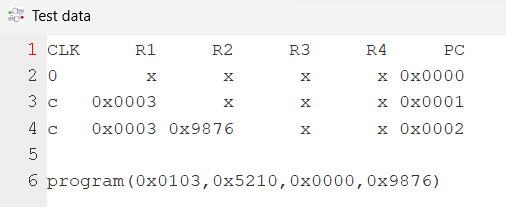
More information and help on this will likely be given before your 1st assignment.
Having test cases and the circuit in seperate files#
You can put your test cases in a seperate file to your circuit, and then run the test cases on your circuit using a command from the command line. Digital’s API for this is described in Chapter 7: Script-controlled testing of the documentation. This can be useful for your CPU because you can keep your CPU and tests in seperate files, and not have to search through your CPU file to look for where you put your tests in it.
Other#
As discussed in the keyboard shortcuts section, you can place a tab with components on the left of your screen for easy access:
- Make it the default in
Edit > Settings > Make component tree visible in startup - Manually enable/disable it in
View > Component Tree View - Keyboard shortcut: F5
When your circuit won’t run because of an error, if you run the tests, then it will just give you an error message. However, if you run the circuit manually (see above), you’ll find that underneath the error message, it highlights the component that failed in red. This can be useful for pinpointing the source of the error.
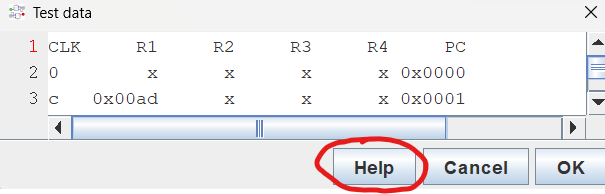
If you want to learn more about what you can do in test cases, press the help button when you are in the test case editor (i.e. the window where you write your test cases) as shown below, and you will get a page describing all the things you can do. The name of the page should be “Test vectors”.
Microbit#
Read the resources we provide you#
There are many resources linked on the References and Links page, which encompass pretty much everything you need! The most important are of course the ARM assembly cheat sheet and reference manual, but there’s also more niche things like documentation for the GNU assembler, which tells you what compiler directives (like .word and .global) you can use.
Also check out the Microbit Style Guide! Good style and commenting will not only make your programs understandable but will also help you code better. When you write a function description, understand it as “okay, this is what my function is meant to do; I understand it now because i’ve written it down”.
Read the error message!#
When you have an error and your program’s not compiling, your first step should be to read the error message! Don’t succumb to the urge to throw up your hands as soon as you get an error, because usually it’s just a simple syntax problem or typo and you can fix it easily! Just look at what line the error message says is the problem, and 9 times out of 10 you’ll immediately see the issue.
However, some error messages can be confusing. Here are a few of them and some troubleshooting tips:
- “garbage following instruction”:
- If you’re using constants, try to see if removing the hashtags helps (so instead of
mov r2, #2,mov r2, 2) - If you’re using an instruction with an inline shift, like
add r1, r2, lsl #2, the assembler requires that you specify the destination register explicitly, so in this caseadd r1, r1, r2, lsl #2. This is because it’s expecting a possible third register when it reads “lsl” and, having found something that’s not a register, complains.
- If you’re using constants, try to see if removing the hashtags helps (so instead of
- “cannot represent T32_OFFSET_IMM relocation in this object file format”
- If you’re doing something like
ldr r1, label, then this error may occur. The fix is to load the label address into a register seperately to loading the value from the address, so in this caseldr r0, =labeland thenldr r1, [r0]. - This error message also occurs if you write
ldr r1, r2without putting square brackets around the second operand. Remember that it needs to beldr r1, [r2]!
- If you’re doing something like
- Error: .size expression for label_name does not evaluate to a constant
- This usually occurs because you have the corresponding line for your function
label_namebelow a.datadirective, eg:.type label_name, %function label_name: @ code here... bx lr @ ... .data @ <------- .size label_name, .-label_name @ <-------
- This usually occurs because you have the corresponding line for your function
If you encounter other error messages that you can’t decrypt, post them on the course forum!
VSCode snippets#
Assembly can be quite verbose, and you may need to do a lot of typing. This is where VSCode snippets can make life
easier, which allow defining a keyword that can expand to a bunch of text. If you’ve done COMP1110, it’s similar
to how psvm expands to public static void main {} and places your cursor inside the braces, and similar things.
Press Ctrl+Shift+P to open the command palette and go Snippets: Configure User Snippets > arm.json (ARM). You can
then enter snippet templates into this file. For example, replace all the existing text in the file with the below:
{
    "function": {
        "prefix": "function",
        "body": [
            ".type ${1:name}, %function",
            "${1:name}:",
            "\t${0:nop}",
            "\tbx lr",
            ".size ${1:name}, . - ${1:name}"
        ],
        "description": "Function template"
    },
    "global_function": {
        "prefix": "gfunction",
        "body": [
            ".global ${1:name}",
            ".type ${1:name}, %function",
            "${1:name}:",
            "\t${0:nop}",
            "\tbx lr",
            ".size ${1:name}, . - ${1:name}"
        ],
        "description": "Global function template"
    }
}
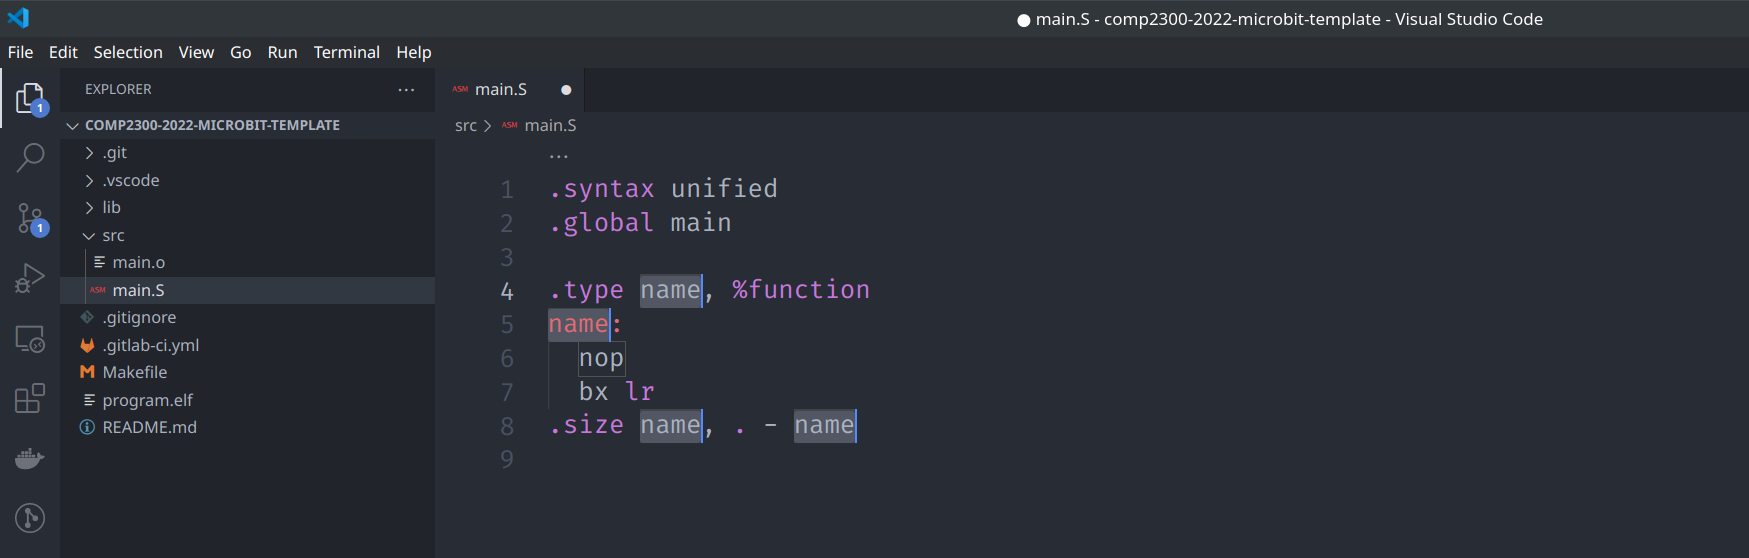
And then, in assembly files, when you start writing “function”, a popup will appear like so:
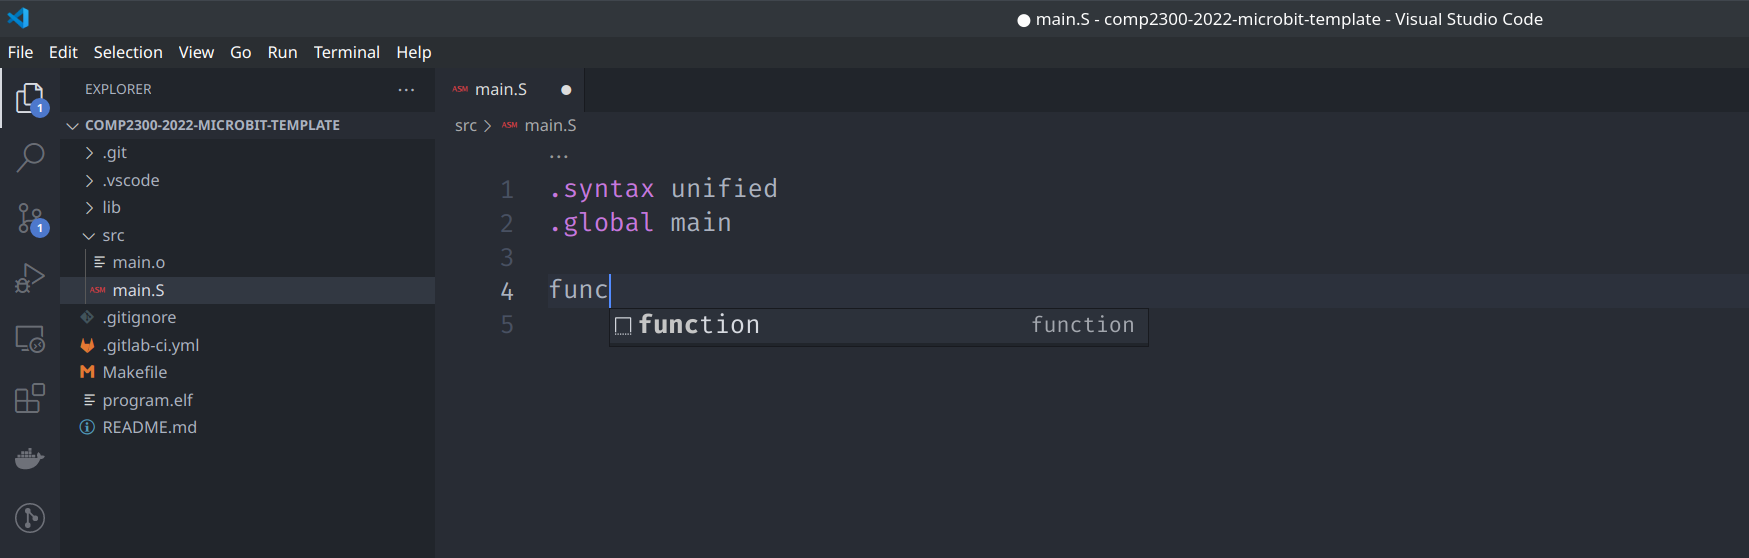
Press Enter or Tab, and it will expand the snippet, writing all of the boilerplate that you need to
define a function and automatically placing your cursor everywhere you need to write the function’s name!
Just type the name and you have your function!
If you divide your code across multiple files, the gfunction snippet is useful for global functions
(see Lab 10’s description of the .global directive). If you want to create your own snippets (e.g. for your data structure for LED images), read more here.
Debugging tips#
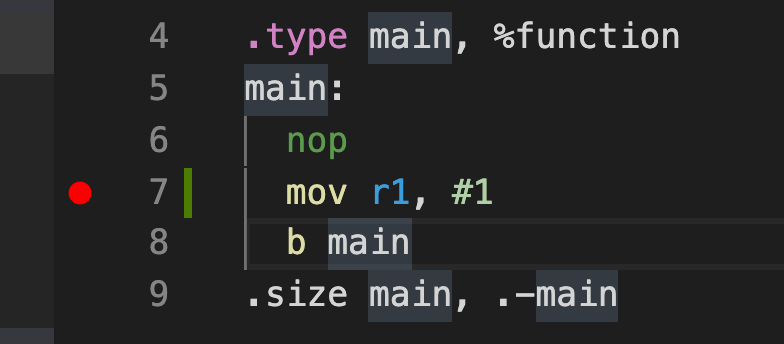
Remember you can set breakpoints by clicking in the left hand “gutter”, which should cause a little red dot to appear like below. Then, you can press the “play” button to set the program running and it will stop on the breakpoint when it reaches it. This is also described in Lab 7.
Once you’re using functions, you will notice that the normal “step instruction” button goes into function calls
and starts stepping through the function. If you’re confident that the function works correctly though, and just
want to see what’s going on at the top level, this may not be desired. You can use the “step over” button circled below in this case, which will skip over function calls. This is also described in Lab 9.
When editing memory mapped registers and using peripherals, you can see the values at peripheral related memory addresses using the Cortex Peripherals pane. This is described in Lab 8.
You can change whether registers values are being viewed in decimal or hexadecimal, either by right clicking
on registers in the Variables panel and clicking “Enable/Disable hex mode”, or by using the Cortex Registers panel
where there’s a button for toggling modes (which initially is labelled “n”).
There are actually two versions of Memory View in the COMP2300 extension: Cortex Debug: View Memory and Cortex Debug: View Memory (legacy). The difference is that the legacy version opens a new tab for memory view while the normal version uses a panel at the bottom of the screen. The COMP2300 extension has wrappers for these with more descriptive names. Some students have found that the legacy version is more robust (the normal one sometimes doesn’t update immediately after stepping past store instructions) so you may prefer that.
Operations for writing constants#
The GNU assembler is very flexible in how you can write constants. In particular, it allows you to use arithmetic
and bit operations in constant expressions. A simple example:
mov r0, 2 * 20
This will get converted to mov r0, 40 when assembled.
Where this is really useful is for creating masks for bit manipulation. Usually you need the mask to be at a certain range of bits, e.g. if you want to extract bits 20 to 23 of a register, you will need a mask which has 1s from bits 20 to 23 (which you will AND with the relevant register). You can achieve this by writing these 1s in the least significant bits, and then shifting them over like so:
mov r1, 0b1111 << 20
Operations on constants include (but not limited to):
| Operation | Symbol | Example |
|---|---|---|
| Addition | + |
mov r0, 0xA + 0xB |
| Subtraction | - |
sub r0, 12 - 1 |
| Multiplication | * |
mov r0, 12 * 0b111 |
| Division (floor) | / |
add r0, 100 / 11 |
| Power | ^ |
mov r0, 2^12 |
| Logical shift left | << |
bic r0, 0b101 << 3 |
| Logical shift right | >> |
orr r0, 0xFF00 >> 2 |
| Logical OR (stacks) | | |
mov r0, 0b101 | 60 | 0xF00 |
| Logical AND (stacks) | & |
mov r0, 0xFF & 0b11 & 1 |
| Logical NOT | ~ |
mov r0, ~0xF |
You can also use this to build constants that fit in a single word by specifying different parts seperately and then shifting + orring them together. This might be of interest to you if you are optimising the LED image data structure you used in Lab 10…
Keyboard shortcuts in VSCode#
- Ctrl+/ to comment/uncomment lines
- Alt+Click allows you to place multiple cursors to put the same text in multiple places at once
-
Ctrl+] to indent, Ctrl+[ to outdent (reverse indents)
- With multiple lines selected, this can be achieved with tab and shift+tab respectively